


我的荣耀 开启荣耀之旅


 Disagree Terms
 Log out


HMS Core | Find Out Everything There Is to Know About Your Apps with HUAWEI Analytics Kit


 Last reply :
After developing an app, you may often ask:
What type of users use my app?
How often do they use the app?
What are the effects of various operation strategies?
HUAWEI Analytics Kit has the answer to all of your questions!
01 What Is HUAWEI Analytics Kit?
The HUAWEI Analytics Kit is a one-stop data analysis platform intended for mobile app developers. Once authorized by users, HUAWEI Analytics Kit helps you clearly understand user behavior patterns based on user behavior events and user attribute data reported by apps and a large number of analysis models preconfigured on the platform, providing an in-depth insight into users, products, and content to help you find out everything there is to know about your apps.
02 What Functions Does HUAWEI Analytics Kit Provide?
The HUAWEI Analytics Kit provides powerful data analysis capabilities for your apps. Through multi-dimensional analysis, you can gain a comprehensive understanding of user interaction in your apps, providing data support for app marketing and product optimization.
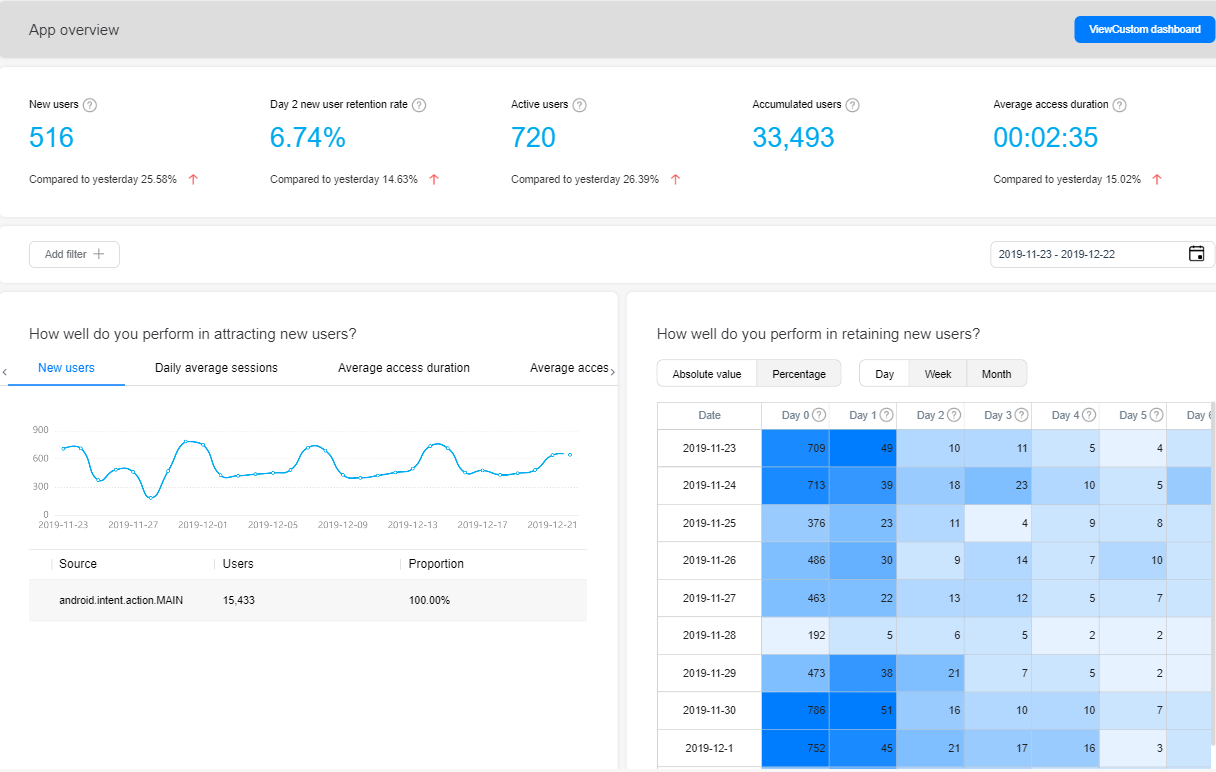
1. App Data Overview
The HUAWEI Analytics Kit displays core data metrics of an app and generates a dedicated data experience report, helping you quickly and comprehensively to understand the overall running status of your app. You can also filter and combine data to create a customized dashboard to meet your personal analysis requirements.
2. Event Analysis
Where does the data in the report come from? We have predefined events and custom events, and data reporting is triggered when a user's behaviour meets a predefined event. A maximum of 500 events can be customized for each app.
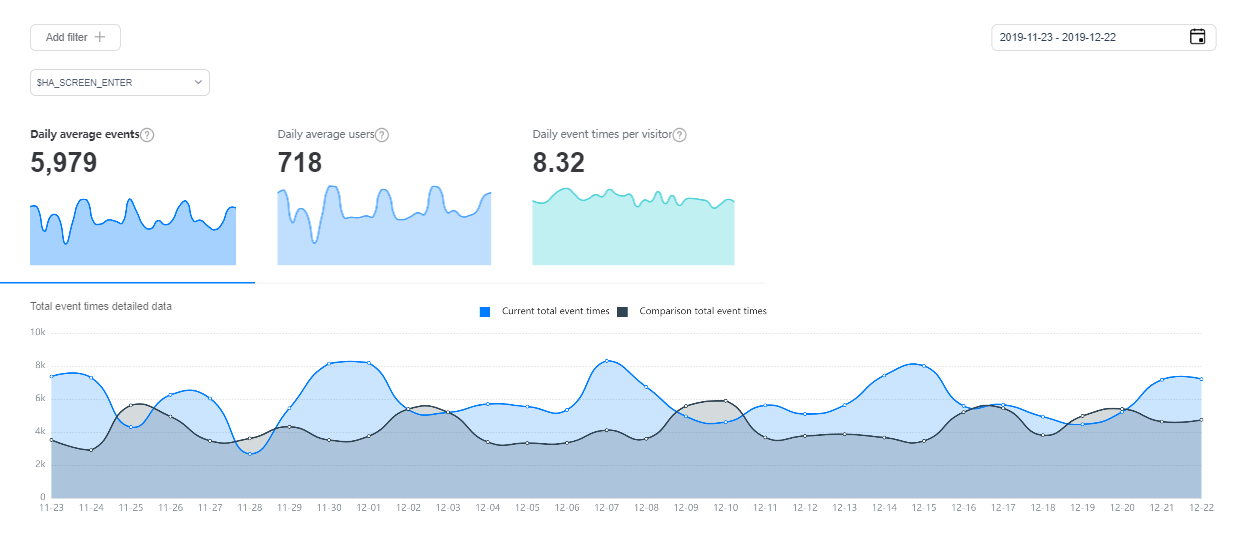
It is, for example, possible to define the product purchase as the most important event so that you can view the average number of daily purchase times by users to analyze the effects of promotion campaigns.
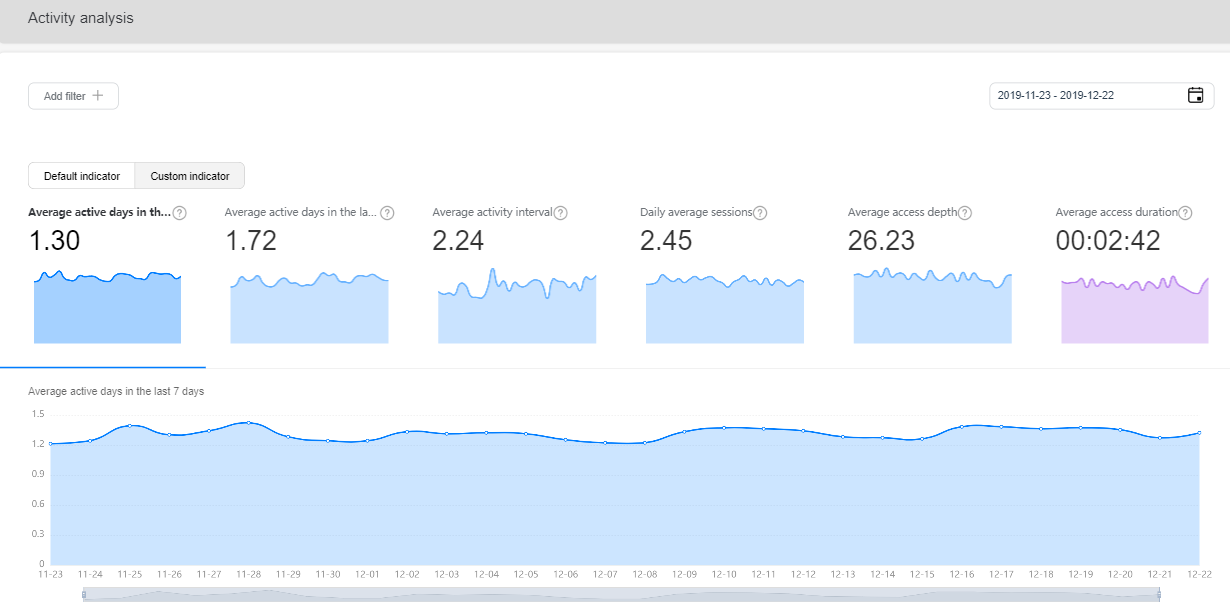
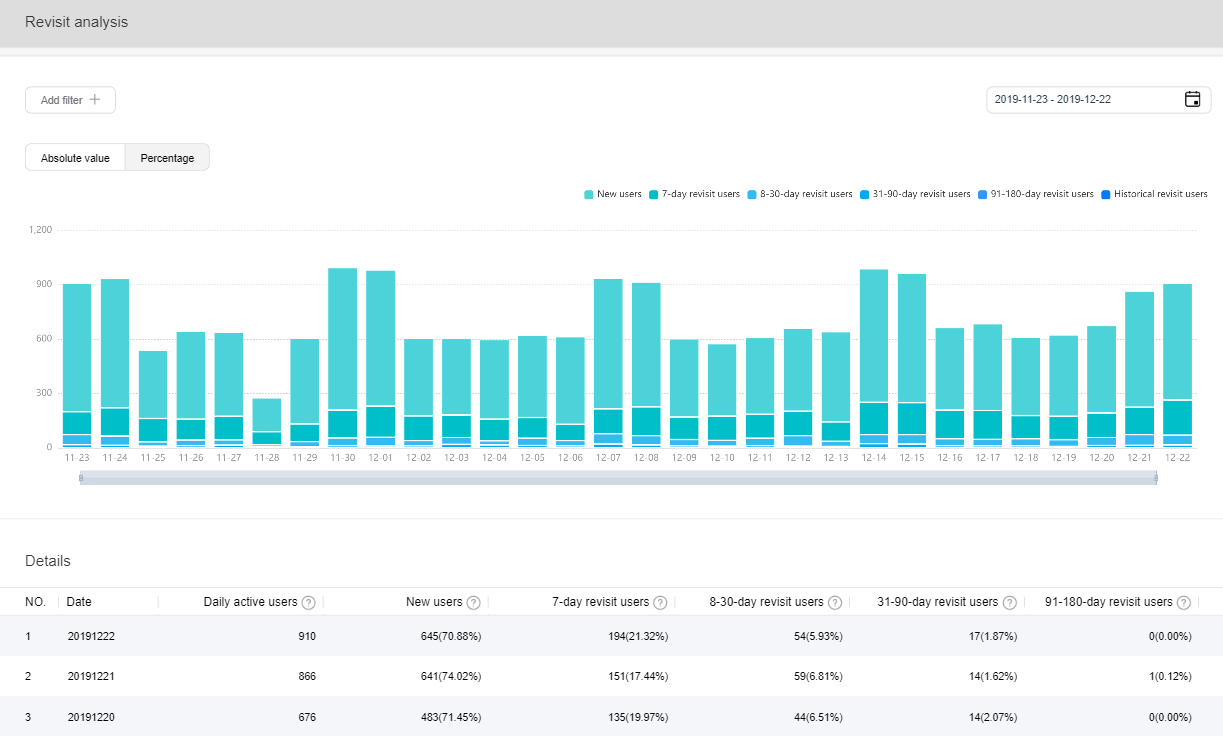
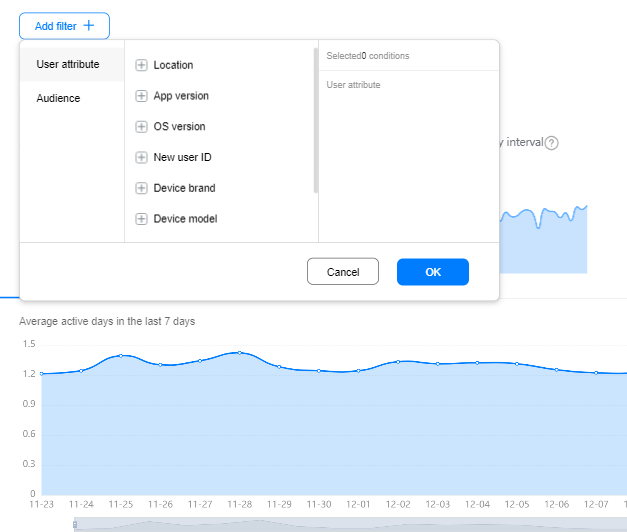
3. User Behavior Analysis
Want to know if users like your app? To find out, give the user behaviour analysis a try. Activity analysis determines the popularity of your apps based on metrics such as the number of active users, average access depth, and average access duration. The revisit behaviour analysis allows you to learn about the product lifecycle and decide upon corresponding strategies based on the user percentage in different revisit periods.
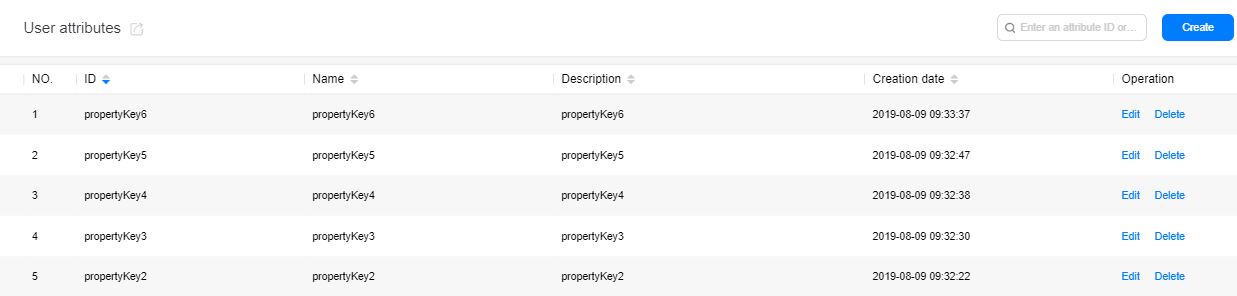
4. User Attributes
Want to categorize users who have similar behaviour patterns? User attributes can help you. For example, if 60% of users in your fitness app like running, you can create an attribute named Sports Preference and tag the users who fit into this category to perform targeted marketing. In addition, it is possible to quickly analyze the behaviour of users who like running in other aspects by filtering their attributes.
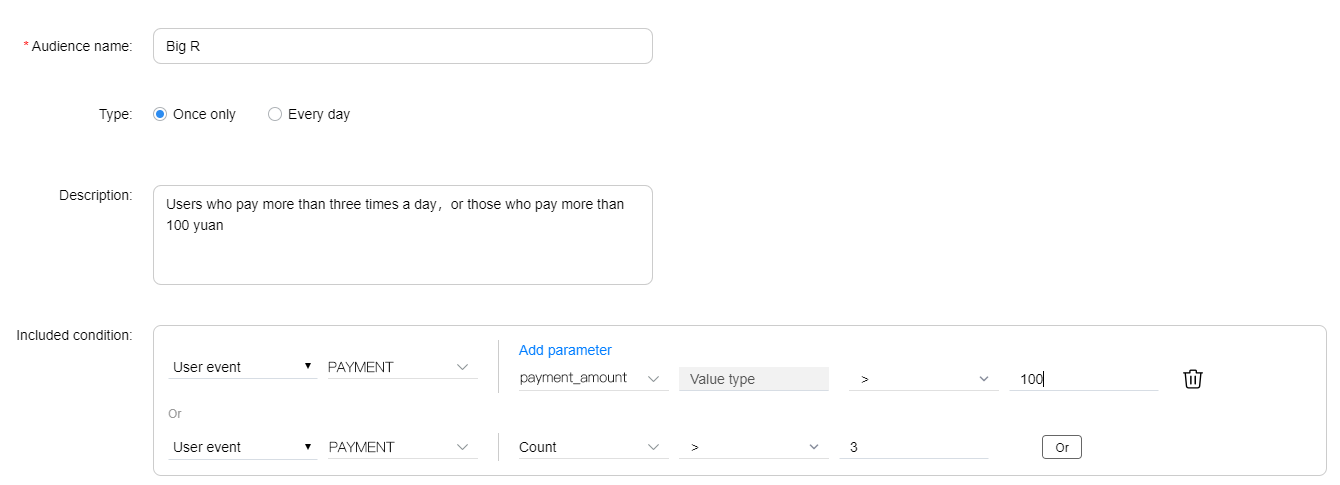
5. Audience Analysis
Based on user attributes, user behaviour, and various filter criteria, you can classify your users into user groups that are more operations-oriented. For example, if a user makes a payment more than three times a day and the payment amount is greater than CNY100, the user is a high-value consumer. In this case, the user needs the maintenance and to be provided with a better service experience. Therefore, audience analysis is a powerful tool for implementing more user-specific operations.
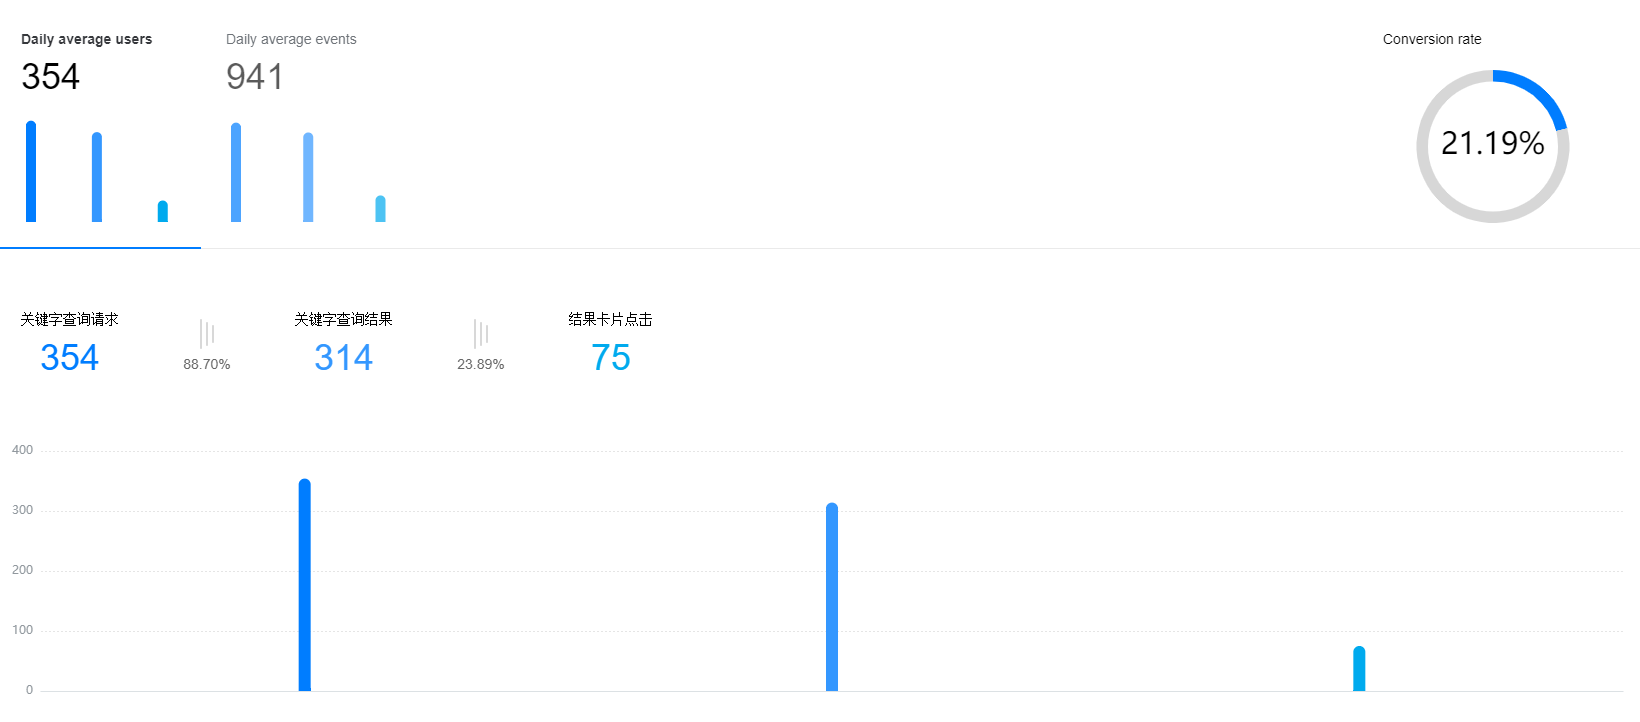
6. Funnel Analysis
Want to know how many users have been converted? Funnel analysis can help you to find this out at a glance! The following figure shows the conversion rate of steps including installing an app, accessing the sign-in page, entering information, and successfully signing in to the app. In this case, the detailed conversion data helps us to understand that the lowest sign-in API call rate of CPs is 20%, as well as the solution to improve the sign-in success rate. The funnel analysis can help you to find the key nodes that affect conversion and provide the base for process optimization.
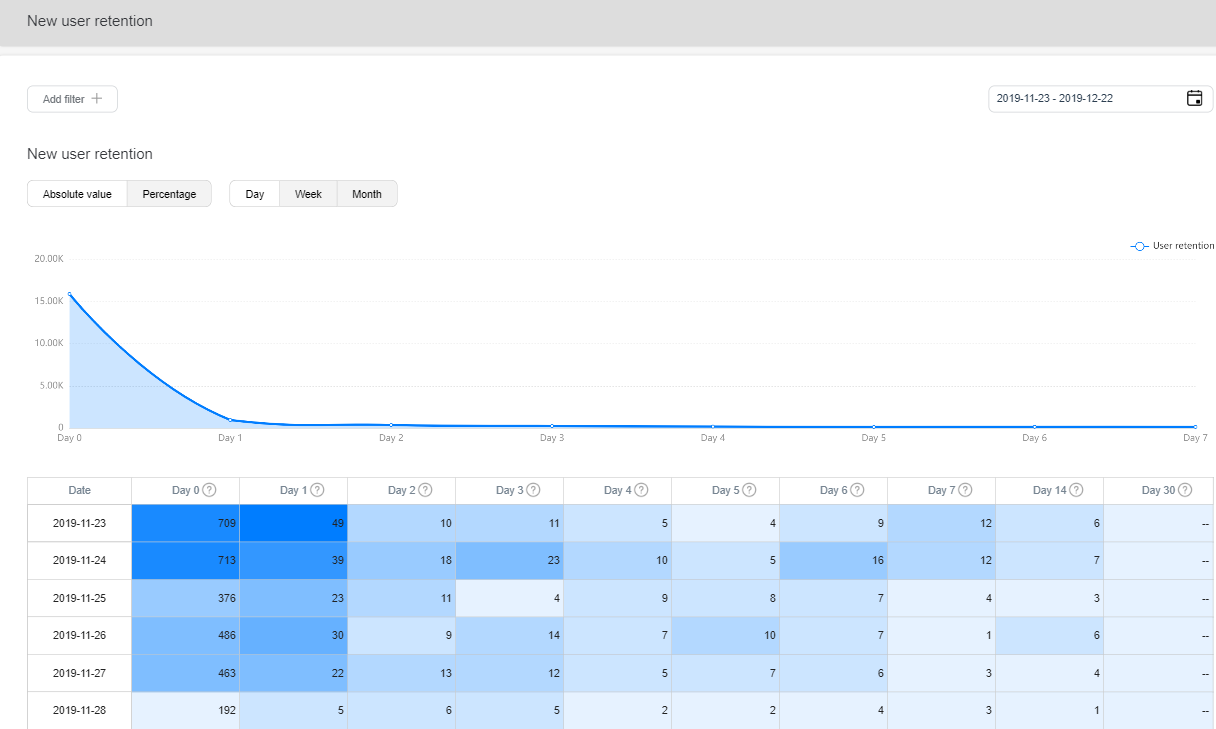
 7. Retention Analysis
Want to know the number of retained users? Let's take a look at the retention analysis! If you find that the number of users retained for seven consecutive days is decreasing, you should consider taking incentive or activation strategies to maintain user loyalty. You can view the new user retention report and active user retention report every day to understand how the current product is attracting users.
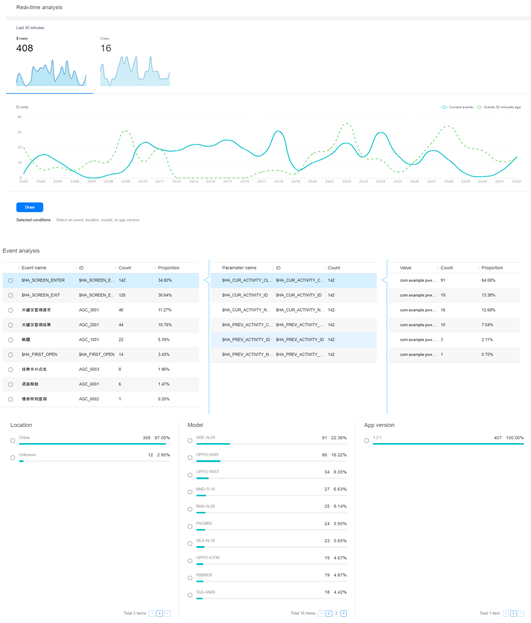
8. Real-Time Analysis
Want to know about operational effects in real time? Here are some tips for you. The real-time analysis displays the counts and percentages of trending events, event parameters, and parameter values. You can also immediately find out the overall data performance and changes after marketing and product improvement.
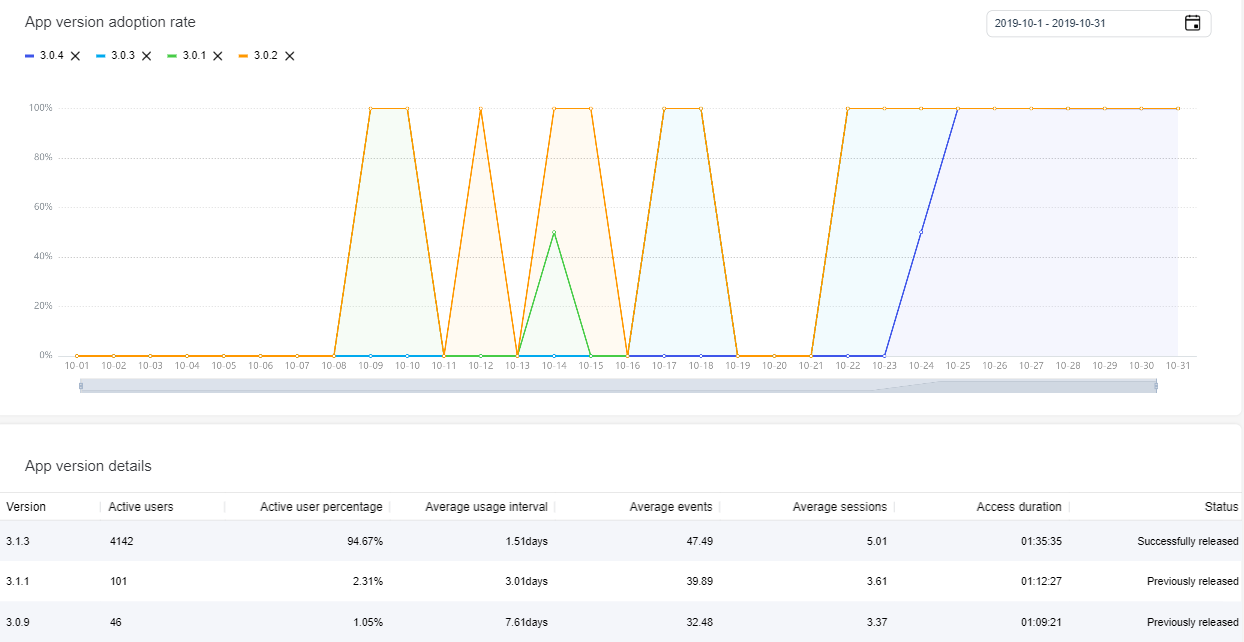
9. App Version Analysis
Are you interested in tracking app version upgrades? Through the version analysis, it is possible to view the number of active users, percentage of active users, average number of events, average access duration, and status of each version to learn about the adoption rate, interaction degree, and stability. This information can help to optimize the upgrade strategy for new versions accordingly.
03 HUAWEI Analytics Kit Maximizes the Value of Data
In addition to powerful data analysis capabilities, the HUAWEI Analytics Kit uses security technologies, such as user identifier anonymization, encrypted transmission, multi-tenant isolation, and dual-cloud deployment, to implement multi-level protection for user data during data transmission and storage.
HUAWEI Analytics can also be used with other services of HMS Core such as the HUAWEI Push Kit, HUAWEI Ads Kit, and HUAWEI In-App Purchases to unleash the maximum value. For example, when you develop a music app, audience analysis allows you to create a rock music fan group consisting of users who have listened to more than 100 songs. The HUAWEI Push Kit sends them a notification about a discount on a rock band's new album, HUAWEI In-App Purchases helps fans of the band purchase albums, and then HUAWEI Analytics Kit automatically generates push and payment analysis reports to help you quickly learn about the operational affect.
Finally, let's take a look at how Tower Defense Empire uses the HUAWEI Analytics Kit to optimize products and user experience.
https://www.youtube.com/watch?v=s4mSU8-yUbk
How can you integrate HUAWEI Analytics Kit into your app? Huawei Developer provides detailed development guidance for you. The entire process of device integration, online commissioning, and data collection can be completed within 30 minutes. Continue reading to find out more.


- Posts
- Following
- Followers
- Energy
-

Musiciantech
-
+ Follow

-
- 17 Posts
- 0 Following
- 27 Followers
- 393 Energy


SUBSCRIPTION
I agree to receive the latest offers and information on HONOR products through email or IM (e.g. WhatsApp) provided below and advertisement on third-party platforms. I understand that I can unsubscribe anytime according to Chapter 5 of HONOR Platform Privacy Statement.
CONTACT

- Posts
- photo
- video

After developing an app, you may often ask:


 7. Retention Analysis


What type of users use my app?
How often do they use the app?
What are the effects of various operation strategies?
HUAWEI Analytics Kit has the answer to all of your questions!
01 What Is HUAWEI Analytics Kit?
The HUAWEI Analytics Kit is a one-stop data analysis platform intended for mobile app developers. Once authorized by users, HUAWEI Analytics Kit helps you clearly understand user behavior patterns based on user behavior events and user attribute data reported by apps and a large number of analysis models preconfigured on the platform, providing an in-depth insight into users, products, and content to help you find out everything there is to know about your apps.
02 What Functions Does HUAWEI Analytics Kit Provide?
The HUAWEI Analytics Kit provides powerful data analysis capabilities for your apps. Through multi-dimensional analysis, you can gain a comprehensive understanding of user interaction in your apps, providing data support for app marketing and product optimization.
1. App Data Overview
The HUAWEI Analytics Kit displays core data metrics of an app and generates a dedicated data experience report, helping you quickly and comprehensively to understand the overall running status of your app. You can also filter and combine data to create a customized dashboard to meet your personal analysis requirements.
2. Event Analysis
Where does the data in the report come from? We have predefined events and custom events, and data reporting is triggered when a user's behaviour meets a predefined event. A maximum of 500 events can be customized for each app.
It is, for example, possible to define the product purchase as the most important event so that you can view the average number of daily purchase times by users to analyze the effects of promotion campaigns.
3. User Behavior Analysis
Want to know if users like your app? To find out, give the user behaviour analysis a try. Activity analysis determines the popularity of your apps based on metrics such as the number of active users, average access depth, and average access duration. The revisit behaviour analysis allows you to learn about the product lifecycle and decide upon corresponding strategies based on the user percentage in different revisit periods.
4. User Attributes
Want to categorize users who have similar behaviour patterns? User attributes can help you. For example, if 60% of users in your fitness app like running, you can create an attribute named Sports Preference and tag the users who fit into this category to perform targeted marketing. In addition, it is possible to quickly analyze the behaviour of users who like running in other aspects by filtering their attributes.
5. Audience Analysis
Based on user attributes, user behaviour, and various filter criteria, you can classify your users into user groups that are more operations-oriented. For example, if a user makes a payment more than three times a day and the payment amount is greater than CNY100, the user is a high-value consumer. In this case, the user needs the maintenance and to be provided with a better service experience. Therefore, audience analysis is a powerful tool for implementing more user-specific operations.
6. Funnel Analysis
Want to know how many users have been converted? Funnel analysis can help you to find this out at a glance! The following figure shows the conversion rate of steps including installing an app, accessing the sign-in page, entering information, and successfully signing in to the app. In this case, the detailed conversion data helps us to understand that the lowest sign-in API call rate of CPs is 20%, as well as the solution to improve the sign-in success rate. The funnel analysis can help you to find the key nodes that affect conversion and provide the base for process optimization.
Want to know the number of retained users? Let's take a look at the retention analysis! If you find that the number of users retained for seven consecutive days is decreasing, you should consider taking incentive or activation strategies to maintain user loyalty. You can view the new user retention report and active user retention report every day to understand how the current product is attracting users.
8. Real-Time Analysis
Want to know about operational effects in real time? Here are some tips for you. The real-time analysis displays the counts and percentages of trending events, event parameters, and parameter values. You can also immediately find out the overall data performance and changes after marketing and product improvement.
9. App Version Analysis
Are you interested in tracking app version upgrades? Through the version analysis, it is possible to view the number of active users, percentage of active users, average number of events, average access duration, and status of each version to learn about the adoption rate, interaction degree, and stability. This information can help to optimize the upgrade strategy for new versions accordingly.
03 HUAWEI Analytics Kit Maximizes the Value of Data
In addition to powerful data analysis capabilities, the HUAWEI Analytics Kit uses security technologies, such as user identifier anonymization, encrypted transmission, multi-tenant isolation, and dual-cloud deployment, to implement multi-level protection for user data during data transmission and storage.
HUAWEI Analytics can also be used with other services of HMS Core such as the HUAWEI Push Kit, HUAWEI Ads Kit, and HUAWEI In-App Purchases to unleash the maximum value. For example, when you develop a music app, audience analysis allows you to create a rock music fan group consisting of users who have listened to more than 100 songs. The HUAWEI Push Kit sends them a notification about a discount on a rock band's new album, HUAWEI In-App Purchases helps fans of the band purchase albums, and then HUAWEI Analytics Kit automatically generates push and payment analysis reports to help you quickly learn about the operational affect.
Finally, let's take a look at how Tower Defense Empire uses the HUAWEI Analytics Kit to optimize products and user experience.
https://www.youtube.com/watch?v=s4mSU8-yUbk
How can you integrate HUAWEI Analytics Kit into your app? Huawei Developer provides detailed development guidance for you. The entire process of device integration, online commissioning, and data collection can be completed within 30 minutes. Continue reading to find out more.